Blog
consequential-lca.org
October 15, 2015 by Bo Weidema
I am really delighted to announce today a new open resource on consequential Life Cycle Assessment modelling: consequential-lca.org.
The new website is a collection of examples illustrating how to model consequential product systems in LCA as it is recommended in the ISO 14040 series. It provides free access to information, which is often hidden deep within LCA reports or even left out in brief scientific papers to save space.
consequential-lca.org is a community resource. We hope that the community of LCA practitioners will contribute further examples of good practice so that the website will grow to show solutions in as many different application areas as possible.
You can also contribute!
The development of the new website is proudly sponsored by 2.-0 LCA consultants, reflecting our 15 years of experience and commitment to consequential LCA as the scientific approach to LCA modelling.
During our 15 years of existence, we have given a lot of free advice to developers of standards and guidelines, and much of this is now collected in this new website.
2.-0 LCA consultants also continues as the main sponsor for the International Life Cycle Academy (ILCA) where you will find sustainability and LCA-related courses based on consequential thinking.
Quantifying the social footprint
September 8, 2015 by Bo Weidema
As already described in a previous blog-post on social LCA my first entry into the world of LCA in the early 1990’ies was from a social (fair trade and organic agriculture) perspective. Compared to then, we have now much better data and also better methods for social impact assessment. My role in the development of social LCA has mainly been – and continues to be – to insist on the need and feasibility of a quantitative approach to measuring social pressures and impacts, as you can find e.g. in my suggestions of social indicators and characterisation methods (Weidema 2006a, 2006b).
While developing these indicators and methods, I divided the impacts in two groups: Those that were the responsibility of and could be influenced by governments and those that industry could directly influence, and thus be responsible for. Since most LCAs not to evaluate public governance, but rather for industries, I disregarded the former and focused on the latter.
I now realise that this was a mistake. Because industry plays a key role in influencing governments. And it makes all the difference whether industries play their roles passively, taking advantages of low labour costs or even perpetuating the unfair distribution of resources, or whether they play active and positive roles, by paying taxes – directly or indirectly – and creating shared value in their societies. This choice – between a passive and an active role – implies a co-responsibility of industries for the current state of the economies in which they operate. And using this concept, we have now found a way to quantify the overall social impact that an industry (and its products) has, both positively (in re-distributing income to low-income groups and by actively contributing to activities that create shared value together with the local communities) and negatively (via the co-responsibility for the missing local governance that comes with low labour costs). The net impact, measured in utility-weighted monetary units, we call the “social footprint”.
The quantification of the “social footprint” is based on the concept of potential productivity (Weidema 2009) and the quantification of relative income inequality (Layard et al. 2008), and has become possible due to the recent availability of global input-output databases with a high country and sector detail, such as EXIOBASE and EORA. Using standard LCA methodology, the “social footprint” provides a top-down aggregated value of all the externalities related to human activities, both biophysical, economic and social, and a breakdown by country and industry.
In contrast to other social LCA methods it does not initially require site-specific data and does not provide a breakdown of all the possible contributing impacts. Further development of the method will provide more details on specific social impact categories. For inclusion of positive impacts from creating shared value in the local social hotspots identified by the method, company-specific data will of course still be required. We first presented, shared and further developed the method and database through the social LCA club (work is now continued in the LCSA-club)
References
Layard R, Nickell S, Mayraz G. (2008). The marginal utility of income. Journal of Public Economics 92:1846–1857.
Weidema B P (2006a). The integration of economic and social aspects in life cycle impact assessment. International Journal of Life Cycle Assessment 11(1):89‑96. https://lca-net.com/p/1024
Weidema B P (2006b). Social impact categories, indicators, characterisation and damage modelling. Presentation for the 29th Swiss LCA Discussion Forum, 2006‑06‑15. https://lca-net.com/p/1021
Weidema B P (2009). Using the budget constraint to monetarise impact assessment results. Ecological Economics 68(6):1591‑1598. https://lca-net.com/p/194
A new wastewater initiative
July 28, 2015 by Ivan Muñoz
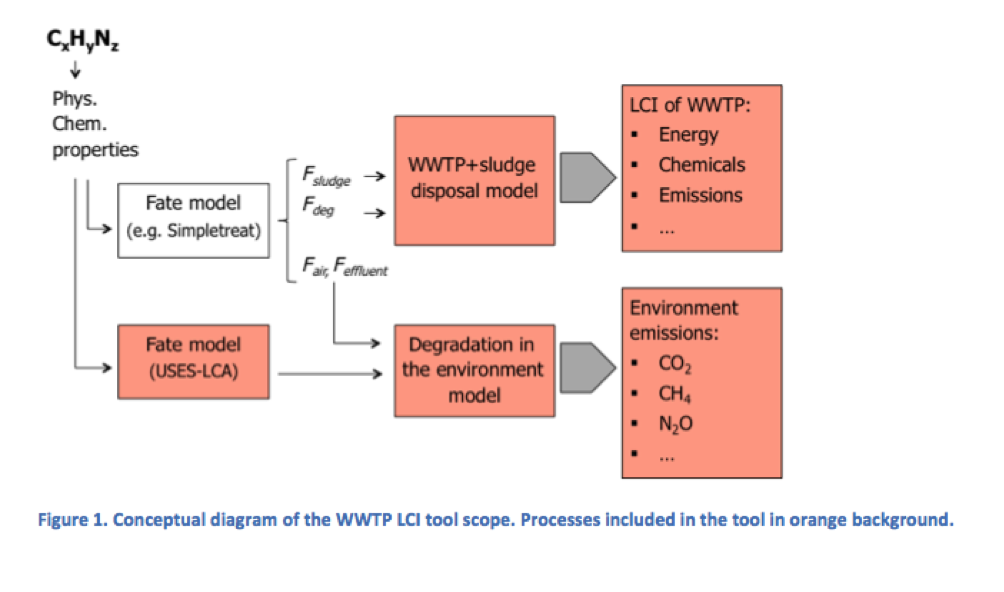
Chemicals are ubiquitous. They are needed, directly or indirectly, for all products and services. In consumer products in particular, very often the fate of chemicals after consumer use is to be sent down the drain to municipal wastewater treatment plants (WWTP).
In these plants typically they are subject to biological treatments leading to their degradation, and to the discharge of the degradation products to the environment. However different chemicals behave differently in WWTPs, depending on their physical- chemical properties and biodegradability. An accurate modelling of the life cycle impacts of chemicals requires taking into account this specific behaviour in a WWTP, namely whether a chemical will be:
- Degraded,
- Volatilized,
- Persistent and just change phase to the sludge,
- Persistent and be discharged to the environment, unchanged,
- A combination of the above.
WWTPs have been extensively assessed by means of LCA. Besides case studies on particular plants, some models are available which allow the practitioner to obtain the inventory for treating a wastewater that has a particular pollution load. The best example of this is the model developed by Gabor Doka for the ecoinvent database, programmed in Excel (Doka 2007). With this tool it is possible to quantify the inputs (chemicals, energy, etc.) and outputs (emissions to air, water, soil) from treating wastewater, including not only the WWTP itself but also sludge treatment through incineration or spreading on farmland.
However, the major drawback of this model, when applied to chemicals, is that it considers the average fate of chemical elements in typical municipal wastewater. Thus this tool cannot be used to accurately reflect the fate of specific chemicals or chemical mixtures in a WWTP.
To alleviate this we have, together with Henkel and Procter & Gamble, started the wastewater LCI initiative with the aim of developing a model to calculate life cycle inventories of chemical substances sent down the drain, taking into account wastewater treatment, sludge disposal, and degradation in the environment (see figure 1). This project is established as a club to which anyone can subscribe. The wastewater life cycle initiative is administrated by 2.-0 LCA consultants. For more information and subscription, please contact 2.-0 LCA consultants: https://lca-net.com/clubs/wastewater/
 Literature
Doka G (2007), Life Cycle Inventories of Waste Treatment Services. Final report ecoinvent 2000 No. 13, EMPA St. Gallen, Swiss Centre for Life Cycle Inventories, Duebendorf, Switzerland.
Harnessing the End-of-Life Formula
May 21, 2015 by Bo Weidema
 The so-called End-of-Life formula has received a lot of attention lately. Currently, public commenting is open for the first “Environmental footprint” pilot drafts that use the 50:50 End-of-Life formula of the EU PEF Guideline (EU 2013).
The End-of-Life formula is an attempt at dividing the benefit of recycling between the suppliers of scrap and the users of scrap. The 50:50 formula divides this benefit equally between the two.
The main criticism of the formula is that this does not reflect how recycling markets work in real life, and the use of the formula therefore leads to misleading information and perverse incentives to the market actors:
- The PEF 50:50 End-of-Life formula implies that demanding scrap will result in an increase in the amount available for recycling corresponding to 50% of the demanded scrap, and will give the user of scrap an equivalent credit for reducing the need for virgin material. The only way this can reflect real life is by assuming that a demand for scrap stimulates a marginal change in market price for scrap, leading to exactly 50% increase in supply.
- Likewise when sending scrap to recycling, the PEF 50:50 End-of-Life formula implies that only 50% of this will be recycled. Again, the only way this can be understood is by assuming that the increased supply of scrap leads to a marginal decrease in price, causing exactly a 50% reduction in supply of scrap from other actors on the market.
The problem with the 50:50 EoL formula is that it tries to combine two distinct market situations into one formula:
- The first part of the EoL formula (involving R1: the amount of scrap demanded) is relevant in a market situation where there is a surplus of scrap available. In this situation, an increase in demand for scrap will lead to more recycling (equivalent to the entire additional demand and not only 50%), while supplying more scrap will only increase the need for disposal of the surplus.
- The second part of the EoL formula (involving R2: the amount of scrap supplied to recycling) is relevant in a well-established recycling market where all collectable scrap is already recycled, and increase in demand for scrap therefore cannot cause any increase in the amount of scrap available, while sending material to recycling will lead to an equivalent (not only 50%) increase in recycling.
The attempt to place both situations into one formula is what causes the problem.
But the problem has a solution: An alternative, more realistic approach is already provided in the PEF Guide (EU 2013) since it requires that “wherever possible, subdivision or system expansion should be used to avoid allocation. (…) System expansion refers to expanding the system by including additional functions related to the co-products”, corresponding to the normal consequential modelling as described in ISO 14044/49. System expansion corresponds to using the first part of the End-of-Life formula (with 100% credit to the user of scrap) in a market situation where there is a surplus of scrap available and the second half (with 100% credit to the supplier of scrap) when all collectable scrap is already recycled. In this way, system expansion provides an incentive for using scrap when the market for the material in question is decreasing, and for supplying scrap when the market is expanding, which is exactly what is needed to increase recycling in these two respective situations. When the recycling rate is below its environmental optimum, the system expansion procedure furthermore gives credit for specific actions that increase recycling capacity. For details on this modelling and its rationale, see Chapter 5.7 in Weidema (2003).
Since allocation can always be avoided by subdivision or system expansion, as demonstrated in the ecoinvent system model ‘Substitution, consequential, long-term’, the quoted PEF Guide requirement actually makes superfluous the more elaborate End-of-Life formula for recycling allocation. Using system expansion only for some by-products and the End-of-Life formula for what is seen as situations of recycling would create an inconsistency in the system models, and can therefore not be intended (furthermore, no definition is given in the PEF Guide as to when when the use of a by-product should or should not be seen as a case of recycling).
The good news is that on an EU workshop on the topic, held on October 6th 2014, Michele Galatola, team leader of the PEF pilots, stated that “During this part of the pilot phase (1st wave pilots screening studies) we want to gather as much knowledge as possible on the pros and cons of using the “single formula” approach. If the results gathered from the screenings convince us that the single formula will never work, then we might consider to test in the second part of the pilot phase an alternative approach…”
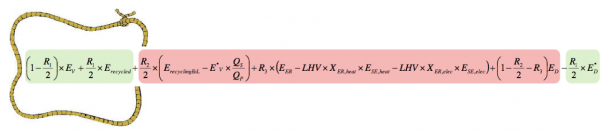
Another good news is that Wolf & Chomkhamsri (2014) have succeeded in elegantly re-formulating the most important parts of the above-described long-term consequential modelling principles into a new encompassing formula that they call “The integrated formula”, and that this has already been recommended by the PEF pilot on metal sheets (Eurometaux 2015).
It looks like the stray End-of-Life formula is slowly being reined in.
References:
EU (2013). Product Environmental Footprint (PEF) Guide. Published April 9th as annex II to the Commission Recommendation on the use of common methods to measure and communicate the life cycle environmental performance of products and organisations.
Eurometaux (2015). Product Environmental Footprint Category Rules (PEFCR) for “Metal Sheets for various applications”. Revision 0.4 29/04/2015
Weidema B P. (2003). Market information in life cycle assessment. Copenhagen: Danish Environmental Protection Agency. (Environmental Project no. 863) https://lca-net.com/p/1078 Chapter 5.7. on Recycling.
Weidema B P. (2013). Guide to interpret the EU product environmental footprint (PEF) guide. Aalborg: 2.‑0 LCA consultants. https://lca-net.com/p/235
Wolf M-A, Chomkhamsri K. (2014). The “Integrated formula” for modeling recycling, energy recovery and reuse in LCA. White Paper. Berlin: maki Consulting & P.P.P. Intertrader.