Blog
Social valuation – Questions and answers
September 9, 2019 by Bo Weidema
I recently responded to a questionnaire from Copper8 on “social valuation” and thought that some of the answers might be of general interest, so I share them here:
1. What is your definition of social valuation?
We normally speak of social assessment, where assessment is the full study including human activities, their interaction, the externalities and their cause-effect chains (as in ‘Life cycle sustainability assessment’), while valuation is only the last step in the impact assessment where the relative severity of different impacts are valued by individuals in order to make comparisons and trade-offs.
We normally speak of social in the sense of ‘aggregated at the level of society’, which is the common usage in economics since Marx (1885), but acknowledge that it can also be used in the more narrow sociological sense of ‘pertaining to the interactions between people’; see also reply to question 4. Maybe it would be best to talk only of social in the societal sense and call the rest inter-personal?
2. What is the scope of social valuation in current methodologies?
The scope for our assessments is the full product life cycle, i.e. the system of interlinked activities that change as a consequence of producing and consuming a product. We may additionally assess the impacts of the supply chain (the system of interlinked activities that contribute one or more specified and intrinsically linked physical properties to a product), or the value chain (the system of interlinked activities that contribute added value to a product). The three types of systems are described in our article at http://lca-net.com/p/2919.
3. What is the status of quantifying social impacts currently? We want to measure social impact on a product or material level, how would you do this? What is the best way to link social impact to (components of) products or materials?
First, social impacts are quantified per product at the organizational level and these are then aggregated over the analysed product system, using the standard life cycle assessment methodology.
4. Is there an overlap between economic, environmental and social valuation and how do you deal with that?
The social assessment (=Life Cycle Sustainability Assessment) includes the internalised costs and benefits by the use of Life Cycle Costing, as well as the social (inter-personal) externalities, the economic externalities, and the biophysical externalities by the use of Life Cycle Assessment. At the level of pressure indicators, it is possible to distinguish between the social (inter-personal), economic and biophysical pressures (see http://lca-net.com/p/3289), but at the level of midpoint impacts it only possible to distinguish socio-economic and biophysical indicators, and in the end all impacts contribute to a single indicator of social (sustainable) wellbeing.
The same human activity or the same pressure indicator (such as toxic substance emissions) or the same midpoint impact indicator (such as unemployment) can contribute to more than one impact pathway, where some impact pathways may be classified as economic, some as social (inter-personal) and some as biophysical. However, this classification is irrelevant for the actual assessment, which will proceed in the same way, disregarding the classification. Each impact is assessed individually and then aggregated at the societal level, taking into account synergies and dysergies as well as the (dis-)utility to the affected population.
5. Could you give an example of social value that you have measured?
We assess indicators quantitatively at different levels of detail. The most generic level (for simple screenings) is what we call the ‘Social footprint’, which is composed of three elements: the income redistribution impact, the productivity impact of missing governance, and the potential credits for positive action. This can then be broken down into quantified contributions from more specific impacts, such as the impacts from insufficient education, insufficient health care, insufficient clean water, or undernutrition, as described in http://lca-net.com/p/2858.
We have had two crowdfunded projects that contribute to further detailing and improving these impact pathways, their indicators and their characterisation factors; one specifically addressing social (inter-personal) impacts (Social LCA Club) and one addressing each of the SDG indicators (SDG-Club). The latter includes all impacts that contribute to sustainable development. Both crowdfunded projects were based on the same top-down approach to valuation. Activities now continued in the crowdfunded LCSA Club.
6. How do you assess the value of ambiguous social impacts, e.g. child labour can normatively be seen as a negative social impact, but it also adds to income and employment.
An activity (or a pressure such as child labour) can have several impacts. When one is detrimental and the other is beneficial, they may counteract each other. In practice, each impact is modelled separately and from that the net result can be calculated.
7. How to deal with feedback loops?
Generally, we deal with loops as a standard part of the models. Our models are system of linear equations, and when solving these, either by iteration or matrix inversion, the effects of loops are implicitly a part of the solution.
8. We want to make choices based on the right metrics, not only the measurable ones. How can we make this happen? How do you deal with this?
Our approach is top-down, starting from an assessment of the current annual level of impacts on human wellbeing (people), species loss (planet), and the productivity gap (prosperity). The causes of these impacts are then traced backwards to human activities. To avoid that something is left out due to missing knowledge or missing metrics, we always identify one impact pathway as ‘default’ to take care of the residual impact that is not explained by any of the other impact pathways.
9. What social impact data should/could be collected?
The analysed system will normally be divided in a foreground system for which activity-specific data are collected, and a background system where data come from average statistics for an industry and/or a geographical area. The minimum data that are required per activity or industry are work hours and value added.
10. How do you collect social impact data?
Companies usually supply data for the foreground systems, sometimes these may be verified by an external accountant. Background data are collected from statistical data sources. In the best case, data are available from several independent sources, allowing for triangulation.
11. What is the reliability of social impact data?
Reliability of social impact data is very variable. We use uncertainty estimates that include an assessment of reliability.
12. How to deal with a lack of benchmark data? And what data collection questions are relevant without benchmark data?
The global averages can always be used as benchmark. National and industry averages are also often available. For specific companies, the data for the previous years can be used as benchmark, giving a time series of impact, e.g. per unit of revenue. Using competitor’s performance is more difficult, since these data will seldom be publicly available. An option is when companies cooperate in industry associations.
13. For environmental impact absolute quantitative thresholds have been defined, i.e. the planetary boundaries. Can product social impact be linked to absolute thresholds and would that be meaningful? And can these thresholds be expressed in a monetary value?
In general, the socially relevant threshold is where marginal abatement costs are equal to marginal damage costs. Both these metrics are expressed in monetary units. In our top-down approach, monetary valuation is applied to the endpoints (human wellbeing measure in quality-adjusted person-life-years, species loss measured in numbers, and the productivity gap measured in productivity-adjusted person-life-years). All other contributing indicators – and therefore also thresholds – can then implicitly be expressed in monetary values.
14. Would it be possible to attribute organisational social impact to separate products?
15. Can organizational social impact indicators be translated in product social impact data?
Organisational impacts are attributed to individual products by the standard allocation procedures (for combined production by modelling the changes when producing more of one product and no more of the others; for joint production by modelling how the dependent co-products affect the markets they supply).
Final question: What is the best way to quantify qualitative indicators? E.g. could we use 12 yes/no indicators, of which 8 are scored with a “yes” which accounts to 8/12 = 66.7%?
By nature, qualitative indicators are used when possibility for quantification is insufficient. Quantifying these indicators therefore would be violating the nature and purpose of these data. The purpose of qualitative data is to identify missing perspectives and indicators, and to provide richer local context and a deeper understanding of the motivations, culture, values, power relations and change potentials of the affected societal groups.
Press release on certified palm oil
August 20, 2019 by Jannick Schmidt
Today we have sent out a brief press release on the findings from the Palm Oil Club project which has resulted in a detailed life cycle assessment (LCA) study of palm oil production.
The study compares the environmental impact of RSPO (Roundtable on Sustainable Palm Oil) certified sustainable palm oil with non-certified palm oil in Indonesia and Malaysia.
See the press release here: Certification of palm oil
Global inventory modelling of wastewater discharges
July 24, 2019 by Ivan Muñoz
In May this year we proudly presented the third version of our wastewater inventory model, WW LCI, at SETAC Europe’s 29th Annual Meeting in Helsinki, Finland (see the presentation). This constitutes the 5th consecutive platform presentation about WW LCI in a SETAC conference, which is a good sign of the scientific interest that our model has received so far from the LCA community. We take this milestone as an opportunity to look back at the story behind our model.
 The development of WW LCI started in 2015 as one of our crowdfunded projects, together with the three companies Henkel, Procter & Gamble and Unilever. Our goal was to develop a model and Excel tool to calculate life cycle inventories (LCIs) of chemicals discharged in wastewater. The choice of partners for this project (consumer goods companies) was not a coincidence. Indeed, after use, many of their products, such as shampoos, washing detergents, etc., end up discharged in wastewater around the globe, which makes wastewater LCI modelling a necessity for these companies when carrying out cradle-to-grave LCA studies. Yet, the only commonly available LCI model covering this aspect to date was the one by my good friend Gabor Doka, developed for version 2 of the ecoinvent database. With our project, we aimed at overcoming several limitations of this model. First, we wanted our tool to describe wastewater as a mixture of individual chemical substances rather than a set of generic descriptors such as chemical oxygen demand (COD). Second, we wanted to cover several sludge disposal routes, namely landfarming, landfilling and incineration. Last but not least, we aimed to include the environmental burdens of untreated discharges, which are unfortunately still very common in developing countries. Before the end of 2015, the first version of WW LCI was ready, as well as an article that would ultimately be published the next year in the International Journal of LCA.
Shortly after the development of our model, we got in touch with Prof. Morten Birkved, from the Technical University of Denmark (currently at the University of Southern Denmark), who was involved in the development of SewageLCI, an inventory model to calculate emissions of chemicals through WWTPs. We decided to join forces and integrate the two models, eventually giving rise to the second version of WW LCI, thanks to the hard work of Pradip Kalbar, current Assistant Professor at the Centre for Urban Science & Engineering (CUSE) at IIT Bombay. Pradip’s work led to key improvements in WW LCI, such as the inclusion of wastewater treatment by means of septic tanks, tertiary treatment of wastewater with sand filtration, treatment of wastewater in WWTPs with primary treatment only, treatment of sludge by composting, as well as the integration in the tool of a database containing wastewater and sludge statistics for 56 countries. Also, Pradip was responsible for our second peer-reviewed publication, this time in the journal Science of the Total Environment.
After some quiet time, in 2018 I decided to get to grips with several limitations of the model, such as the fact that it did not support discharges of metals in wastewater, but more importantly, I realized that by describing wastewater as a mixture of individual chemicals, as in e.g. a list of ingredients in a shampoo formulation, I was closing the door to many LCA practitioners who typically can only describe the pollution content in wastewater with the very generic descriptors I had rejected in the first place, namely COD, among others. Thus, I adapted the model to support metals as well as the characterization of wastewater based on the four parameters COD, N-total, P-total and suspended solids. On top of this, many additional features were implemented, mainly aimed at an improved regionalization, that is, to try and make LCIs more country-specific. Some of the improvements made included: emissions of methane from open-stagnant sewers, climate-dependent calculation of heat balance in the WWTPs, capacity-dependent calculation of electricity consumption in the WWTPs, the inclusion of uncontrolled landfilling of sludge, the specification of effluent discharges to sea water or inland water, and last but not least, expanding the geographical coverage of the statistics database from 56 to (currently) 86 countries, representing 90% of the world’s population (figure 1). The result of this effort, in short, is our third and latest version of WW LCI, presented in May at the SETAC conference.
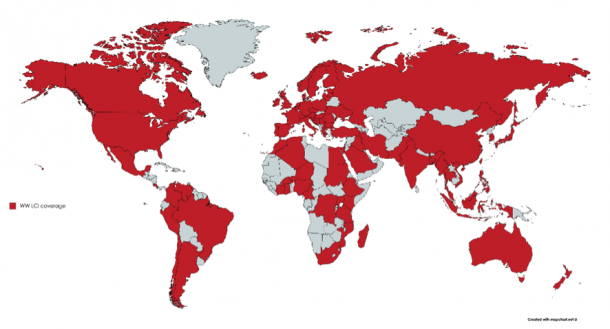
Figure 1. Geographical coverage of the country database in WW LCI.
As an example of the current tool capabilities, the figure below (taken from the SETAC presentation) shows the carbon footprint of discharging 1 m3 of a typical urban wastewater in 81 countries. As it can be seen, there is wide variability between countries (up to a factor 6), with highest emissions in those countries where methane from open and stagnant sewers is expected to occur. On the other hand, emissions are substantially lower in countries where wastewater is properly collected and treated in centralized WWTPs. Obviously, the carbon footprint is not the only relevant metric, and WW LCI can support others just as well, including eco-toxicity.
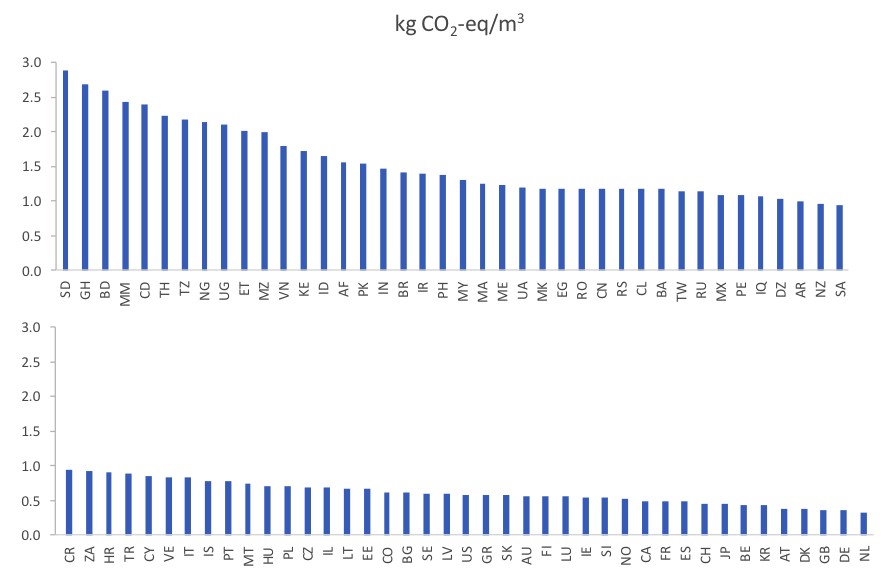
Figure 1. Country-specific carbon footprint of discharging 1 m3 wastewater with a composition of 500 ppm COD, 30 ppm N, 6 ppm P and 250 ppm SS. Global warming potential for 100 years. Impact assessment calculations in SimaPro 8.5. Biogenic CO2 emissions considered to have global warming potential of zero.
Needless to say, WW LCI is not perfect. We can mention as main model limitations the fact that it does not address uncertainty, its data-demanding nature when used to model specific chemicals, the not-so-easy operation of the excel tool and the export of LCIs being currently limited to the software SimaPro. In spite of this, to our knowledge this is the most complete, flexible and regionalized inventory tool to model urban wastewater discharges in LCA studies and we expect it will eventually become the preferred approach for professional LCA practitioners. We are just a few SETAC presentations away from it.
Counter-intuitive LCA results
June 27, 2019 by Bo Weidema
Bio-based plastics with larger effect on global warming than their fossil derived counterparts? Certified forest products that unintendedly are more harmful to biodiversity than the corresponding products from plantation forestry? No environmental effect of demanding recycled paper? All these are examples of LCA results that are not immediately intuitive. Does that mean that they are wrong? Not necessarily.
We are often met by a demand that our results should be immediately understandable and make intuitive sense. And there is no doubt that it is easier to communicate results when they are intuitive. Then they are immediately accepted, although often with a condescending “Ah, that’s typical, science just confirms what we knew already”. But it is when our results are not intuitive, as in the above examples, that there is a chance to learn something new. And this is where real change begins.
Counter-intuitive results are not wrong, they are just harder to communicate. Our common sense – just another word for prejudice – is challenged. Intuition is simply not capable of capturing the results of complex systems – at least not without a deeper explanation. But when that explanation is provided, the counter-intuitive results become intuitively right. Let me demonstrate how that works for the above examples:
Bio-based plastics with larger global warming impact than their fossil derived counterparts? Intuitively, one may think of bio-based plastics as being CO2-neutral due to the uptake of carbon from the air during biomass growth. However, that bio-based plastics have a larger effect on global warming than their fossil derived counterparts moves from being counter-intuitive to be intuitive when we understand that agriculture is not CO2 neutral (due to the need for fuel and fuel-based inputs, such as fertilisers) and even more importantly that up to half of the total greenhouse gas emission from growing biomass can come from the indirect land-use effects (iLUC), see e.g. the data for our life cycle assessments of milk.
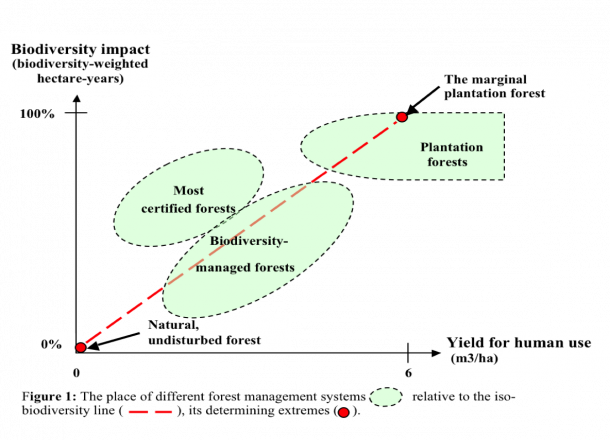
Certified forest products that are more harmful to biodiversity than the corresponding products from plantation forestry? Intuitively, we would expect the certification to lead to lower impacts on biodiversity, since that should be one of the main reasons for the certification. And the biodiversity in the specific certified forest may indeed be higher than in non-certified forests. However, that the certification may unintendedly lead to an overall reduction in biodiversity compared to plantation forests moves from being counter-intuitive to be intuitive when we understand that the overall impact on biodiversity needs to be measured per unit of wood produced. Plantation forests have a high impact on biodiversity per area, but a low area per cubic metre of wood. This means that more area can be left untouched, with no biodiversity impact. If you have a lower output per area than plantation forests, you will need more area to produce the same – and thus impact the biodiversity on a larger area. The challenge is then to have a biodiversity impact that is so low per area that it also becomes lower per cubic metre of wood. This is what we call “biodiversity-managed forests”. However, in practice, it is very difficult to have low impact on biodiversity when you harvest even rather small amounts the wood that would otherwise be “food” for a large share of this biodiversity (“deadwood”). Therefore, most certified forests have higher biodiversity impacts per unit of produced wood than a plantation forest, i.e. they lie above the iso-biodiversity line in the figure below, taken from our criteria for good biodiversity indicators for forest management.
No environmental effect of demanding recycled paper? When we know that the production of recycled paper has lower impacts than virgin paper, we intuitively think that it must be beneficial for the environment to buy recycled paper. And companies that use recycled paper want to be credited for this and brag about it on their product labels. However, that there is in practice no beneficial effect moves from being counter-intuitive to be intuitive when we understand that the amount of recycled paper is not driven by demand but by supply. The market for recycled paper is constrained by the availability of waste paper. So, an increase in recycling can only come about by throwing more paper in the recycling bins, not by demanding more recycled paper. This is so for all materials where there is a well-functioning collection system. For other materials, such as plastics, there may still be situations where the market is driven by demand. And the market situation can change over time, which has caused a lot of confusion about how to apportion the burdens and credits for recycling as described in one of our previous blog-posts.