Open data for Life Cycle Sustainability Assessment
February 20, 2022 by Bo Weidema
4½ years after starting the crowdfunded SDG club we can now present the first complete set of open data for Life Cycle Sustainability Assessment. The results have been made possible by the support from our business partners, including ArcelorMittal, Corbion, Novozymes, and Janus, with funding from the UNEP Life Cycle Initiative SDG project.
The data files include quantitative impact data for 76 impact categories for 163 countries covering more than 99% of global population, GDP and impacts. By applying the ‘capitals’ approach to defining the Areas of Protection, we ensure the 76 impact categories provide an exhaustive coverage of all social, ecosystem and economic impacts. Another unique contribution of our method is the use of sustainable wellbeing (utility, measured in Quality-Adjusted person-Life-Years, QALY) as a comprehensive summary indicator. This allows to quantify relative importance, trade-offs, and synergies across impact categories, and to compare business decisions, performance, and improvement options across industries.
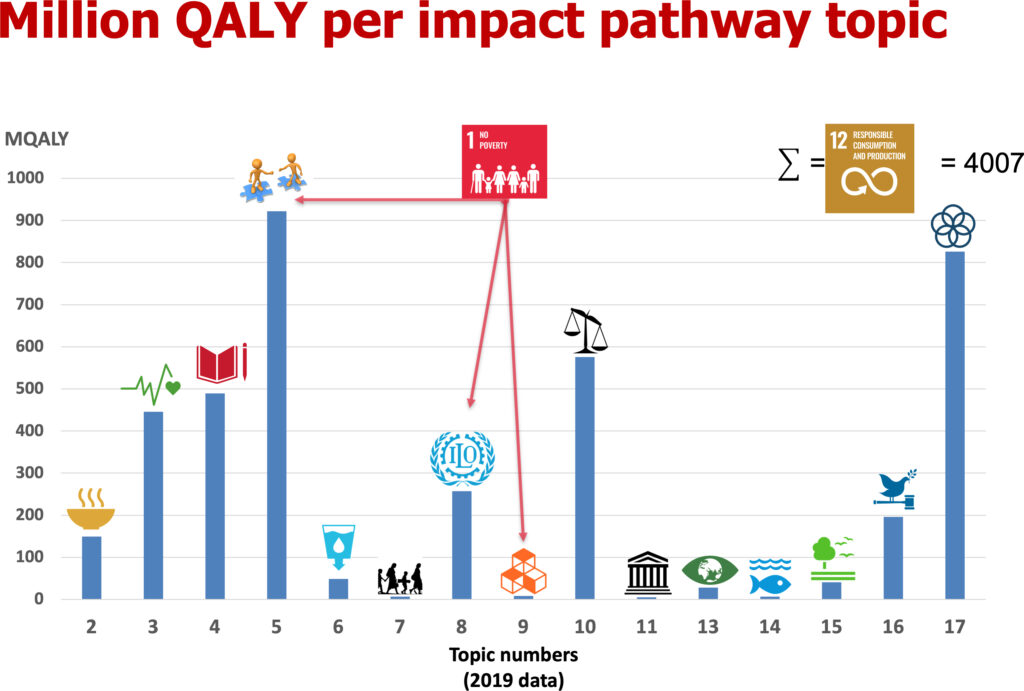
The data files include impact pathways descriptions structured under 17 topics, largely mirroring the 17 UN Sustainable Development Goals (SDGs), however restructuring the indicators so as to avoid overlaps and gaps. The data files include the links between the 17 impact pathway topics and each of the 244 official SDG indicators. Characterisation factors are still under development for each specific impact pathway, linking back to the pressure category indicators, which have been defined to allow for aggregation and disaggregation at any level of geographical, organisational, and product detail.
We find that 31 of the 76 impact categories, representing 78% of all wellbeing impacts, are related to missing governance at the country level, ultimately linked to economic pressure indicators of inequality, notably ‘underpayment of labour and taxes’ and (insufficient) ‘voluntary transfers’. The insight that a large part of the overall impacts (here 78%) come from the same limited set of pressure indicators was used as basis for developing the ‘social footprint’ methodology (Weidema 2018), which has now been updated with these latest method and data improvements. Another 28 impact categories, representing 13% of all wellbeing impacts can be described as having ‘data reasonably available’, including those related to global warming, leaving only 17 impact categories, representing 9% of all wellbeing impacts, with poor availability of pressure category indicators.
The further work on characterisation factors and methodological and data improvements will continue via the crowdfunded Social and Sustainability LCA club where members have early access to updates and support for implementation of the current method in their own case studies.